calendar-project
This project seeks to measure my productivity in quarantine.
Diary of a Data Science Student: How to Avoid Dog Days
Questions of Interest
-
Generally, how am I spending my time in quarantine?
-
Recently, I have been thinking about how to maximize my productivity. In the past, I have observed that while I give myself a lot of time to work on an assignment, I do not make use of the entire chunk of time, especially if it is far away from my deadline. However, on days closer to a deadline, I always do more work. This has led me to wonder, does the proportion of the allotted time that I am actually working increase as I get closer to a deadline? Either way, I want to map my work flow so I know when to give myself the most time when I feel motivated to work. Maybe working closer to the deadline is just my natural work flow and in the future, I should plan for more work time closer to the deadline.
-
I am also wondering what conditions allow me to be more productive. How does the type of assignment (math homework or essay writing) affect my productivity levels? I also tend to work either at my desk or on my bed. How does the work area (bed or desk) affect my productivity level?
Data Collection
I collected data by logging in my daily schedule into Google Calendar. Every morning for 13 days, I logged in my day’s planned activities and stuck to the schedule (for the most part). So, each day I planned set times to do my writing or math assignments or sometimes both. In the dataset, the allottedtime variable tracks the amount of time I gave myself each day. I also logged what I was doing in the rest of the day.
At the end of each work session, I looked at my search history on Google Chrome and calculated the total amount of time that I was on other sites not related to my work, such as Youtube or social media. I put this into my google calendar as part of the summary. When I’m working, the majority of the time that I get distracted is from the Internet, so my search history was an accurate reflection of all the time that I wasted. The timewasted variable tracks the amount of time per work session that was spent off task. I also kept track of where I was working (studyarea), the assignment type (worktype), and the days until the assignment’s deadline (daysleft).
After collecting my data, I downloaded my calendar as a .ics file and began wrangling. There are two datasets: productivitydata, which contains the variables related to my work sessions, and the more general activitydata, which contains all the activities that I have done in quarantine.
Here is a view of my productivity data set:
Results
Question 1: Overall, how am I spending my time?
The graph below shows my daily activity breakdown over a two week period. There is a lot variation in my daily activites! Every day looks a little bit different.
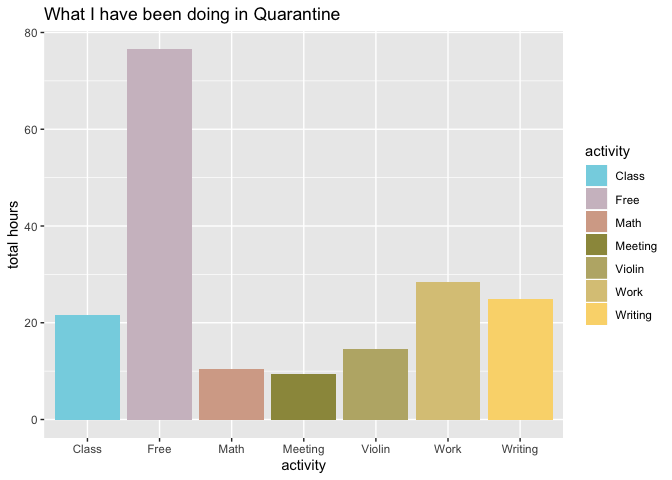
This second plot depicts the total hours that I spent on each activity during the two week period. I did not keep track of the time that I was sleeping or waking up, which explains why there are less hours than there are in two weeks.
I have a lot of free time! By a wide margin, most of the time is going towards free time. This makes sense, because I have had a lot of free time. Because I categorized any time spent eating, exercising, talking with my friends, and watching films/reading as free time, there are many different activities that add to total that is just shy of 80 hours.
At first glance, it doesn’t look like I’m spending a lot of time on school. However, three separate categories are all school work time–if I added up math, writing, and work, this would be about 64 hours of work time. (The work category is for miscellaneous schoolwork that I am not tracking for my productivity analysis).
Questions 2 and 3
While I spent 24 hours writing and 15 hours doing math problems, how much of that time was actually spent working? Often, I found myself sitting down to begin a work session, only to fall down a self care Youtube rabbit hole after ten minutes of focusing.
First, I wanted to explore whether the place that I worked had any effect on my productivity level. The violin plot below depicts this. The bands represent the quartiles while the width of the plot represents the probability density of the data at that value.

There is a lot of variation in both categories, but more in bed than in desk. Desk minutes wasted has an outlier, but most of the data is lower, so the probability density is also lower. In truth, desk is the widest at its lowest values, meaning that it is more probable for me not to waste a lot of time (below 50 minutes) at my desk. Bed is a different story, as it looks like the medians is around 100 wasted minutes.
But wait! Doesn’t the allotted time affect the amount of time wasted? If I give less time to work done in my bed, wouldn’t there naturally be less minutes wasted? To control for this, I compared the proportions of time wasted out of the total allotted work time.
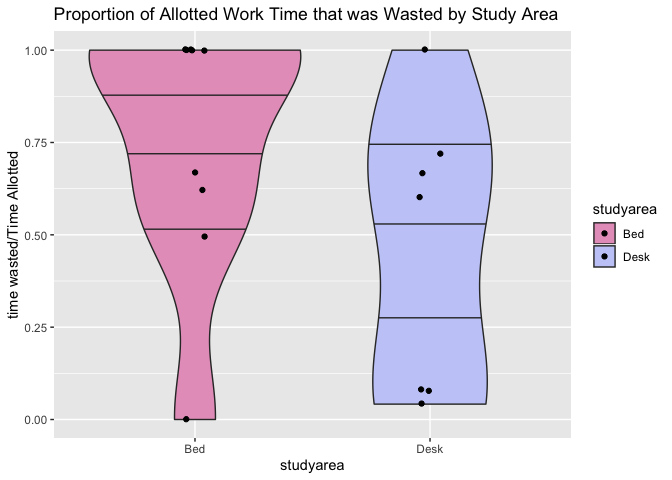
Here, we see that the distributions of proportions of work time wasted are very similar, regardless of the area worked. Therefore, we can eliminate the work area as a factor that has any serious effect on my productivity.
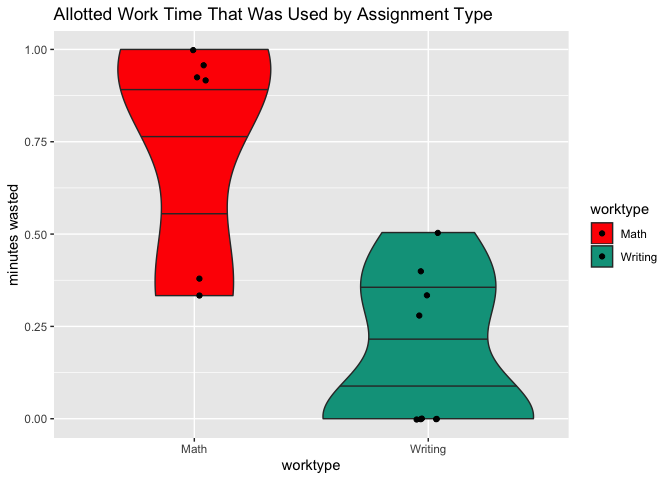
Secondly, I looked at the amount of time wasted by assignment type. At first glance, it looks like there is a lot of variatiion in minutes wasted for writing assignments but not a lot for math assignments. Additionally, there seem to be less minutes wasted overall for math than for writing assignments. However, let’s control for proportions.

After controlling for proportions, we see that there seems to be some difference in time wasted by assignment type. Writing assignments, while having less variation, is predicted to always have at least 50% of the time wasted. By this model, I am always wasting a lot of time when I write! While math does have at least some of its probability distribution fall in the higher end, this may be due to the outlier at 1.00.
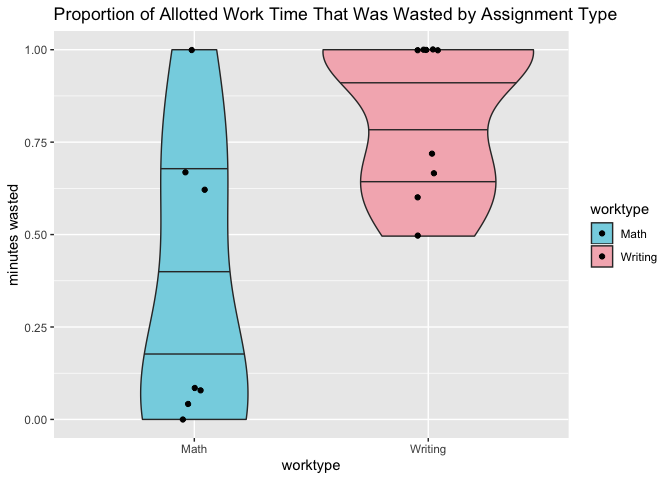
Let’s factor out the outlier at 1.00 for math assignments. Below, we see that the probability density of the data for math does not extend above 0.70 and that the fattest part of the probability density is around 0.1275. However, for writing, the distribution is never lower than 0.50. While there is some overlap, I am clearly wasting more time when writing than doing math.

Inversely, below is a graph of the proportion of time used by work type. We see comparable results to above.
Thirdly, we have a graph that depicts my natural work flow. After averaging over the observations at each day until deadline, the graph shows the amount of time that I’ve given myself for an assignment and the amounnt of time that is actually used. The amount of time that is used is in red while the amount of time wasted is in blue. Of course, because the graph is predicting based on the observations of allotted time and the amount of time that was productive separately, the shaded area is not an exact replica of the proportions of time used and wasted.
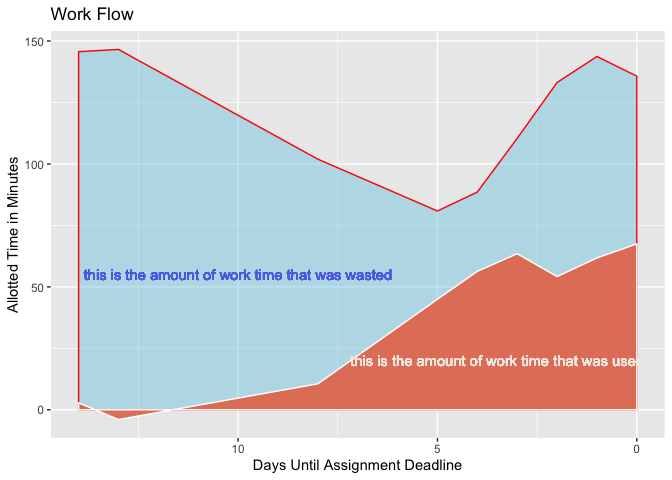
We see that in general, as time gets closer to the due date, I am using more of my time. We have a correlation between the time worked and the days until deadline of -0.4392, which means that there is a moderate correlation between the amount of time worked and the days until the deadline. The negative value indicates that as the number of days until the deadline increases, the proportion of time spent working decreases, or as deadlines draw nearer, the proportion of time spent working increases. This confirms my original estimate.
This graph is also useful because it shows that at the beginning, I am giving myself almost the same amount of work time as the end. Around 5 days, I give myself less work time, even though that is when the rate of work increases. However, if I want to mirror my natural work flow, I should begin to give myself less time prior to ten days until a deadline, as most of that is wasted. I should give myself enough time 5 days prior to a deadline, as I am doing right now. Overall, I see that I overestimate the amount of time it takes to accomplish an assignment, as I am giving myself a lot more time than necessary, as I was able to finish all the assignments in this analysis on time.
Reflection
My analysis generated several conclusions: first, without adjusting for other variables, where I work does not affect my productivity. However, different types of assignments have different levels of productivity: I am way more productive with my time when I am doing math homework versus writing an essay. I am not very surprised, as I did not particularly enjoy the essays I wrote during this period while math was a lot more interesting. Additionally, I concluded that I overestimate the amount of time it takes to accomplish my work, as I am always wasting some time, even on the day of the deadline. In the future, I am going to start giving myself more time to do an assignment closer to a deadline, as I am more naturally inclined to work closer to a deadline. According to the model, only around 10 days do I begin to use the time I give myself to work. Otherwise, I spend all of my allotted time on the Internet. Alternatively, I could try to fix my procrastination habit, but as long as my ability to complete work is not seriously affected, I like my current work flow. Finally, in quarantine, I have a lot of free time in comparison to any other activity.
This project had several limitations. Most fatally, I did not have enough productivity data to make solid conclusions–I only had 16 observations of work sessions. With a small sample size and too much variation, results were not very significant. If I could redo this project, I would keep track of more assignments over a longer period of time. Furthermore, this study can be expanded by predicting the proportion of allotted time from both the assignment type and the time until deadline. A multivariate model is needed to see the true interactions between these variables. Lastly, when I measured the time I was working, I did not consider the quality of work being produced. An interesting direction to explore in the future is how the quality of work changes depending on the work flow.